1. Introduction
Water and water–methanol injection are periodically presented as new technologies for internal combustion engines. However, water injection was already used in Second World War aircraft, and factory-installed systems have also appeared in cars from several manufacturers over different decades.
Our aim was to investigate the benefits of water–methanol injection in competition engines, where the technology has been used in various forms of motorsport for many years. We were also interested in how it interacts with different racing fuels, including the high-alcohol blends permitted in a number of championships.
Racing engine development has long included the search for fuels that improve efficiency. Many fuel manufacturers offer products formulated and homologated for particular motorsport regulations, although their full composition is not necessarily public. Petrol remains widely used, while high-alcohol blends have become more common. Their different chemical properties can significantly affect engine behaviour and allow changes to the engine’s mechanical design.
In our competition application, the primary aim of water–methanol injection was to reduce the risk of engine damage under extreme conditions. Increased torque was a further potential benefit.
Alcohol fuels offer high knock resistance and low vaporisation temperatures, but they also create challenges for the fuel delivery system. High flow rates and injection pressures can heat the fuel. Alcohol viscosity can also increase the energy required for pumping compared with petrol.
2. Water–methanol injection: theoretical background
Before selecting components, we examined the differences between the fuels used in competition. The original study considered the composition of racing petrol, including its carbon content and the role of toluene, as factors affecting combustion and exhaust energy. With an anti-lag system supplying additional oxygen, combustion in the exhaust manifold can help maintain energy at the turbine.
Methanol has a substantially lower heating value than petrol. However, its lower air requirement and higher latent heat of vaporisation can make the energy content of a methanol–air cylinder charge slightly higher than that of a petrol–air charge. Evaporation cools the mixture and can improve volumetric efficiency. The original discussion also considered the expansion of the charge during combustion as a contributor to effective efficiency.
When methanol is used with water for cooling, its low energy density allows relatively large injection quantities. The additional fuel must nevertheless be accounted for when setting the air–fuel ratio.
Ethanol is popular in competition. The original study quoted a vapour pressure of 15–20 kPa at 37.8°C for ethanol. Its effect on petrol vapour pressure is non-linear: even a small addition can raise vapour pressure significantly, while further increases in ethanol content change the behaviour of the blend again. The study also discussed ethanol’s combustion characteristics, knock resistance and exhaust mass as reasons for its suitability for competition engines.
Water injection is not primarily intended to add fuel energy. Water absorbs heat as it evaporates, while the resulting steam contributes to the mass passing through the engine and turbine. The original theoretical discussion considered lower exhaust temperatures and steam expansion together. These effects must not be interpreted as free additional energy.
The source article also discussed the possibility of releasing oxygen from water in diesel engines. This was not demonstrated by the petrol-engine tests described here; water was not treated as a source of combustion oxygen in this application.
The original discussion considered whether the greater mass and inertia of an intake charge containing vapour and water mist could affect intake-wave behaviour. It also highlighted dew point and condensation as considerations when injecting water into boosted air. If total pressure doubles at unchanged composition, the partial pressure of water vapour also doubles, in accordance with Dalton’s law, changing the dew point.
The following tables reproduce the values recorded in the original study. They are historical reference data, not current fuel specifications or universal calibration limits.
| Panta XS | Methanol | Ethanol C85 | Water H₂O | Toluene | |
| Octane rating (RON) | 115 | 108.7 | 106 | 0 | 121 |
| Vaporisation temperature (°C; source label) | 149 | 65 | 85.6 | 100 | 111 |
| Oxygen content (%) | 4.65 | 49.9 | 35 | ||
| Energy density (MJ/kg) | 48 | 22.7 | 34 | ||
| Vapour pressure (kPa, 20°C) | 99.98 | 13.02 | 5.95 | 0 | 3.1 |
| Specific heat capacity (kJ/(kg·°C)) | 2.5 | 2.43 | 4.19 |
Figure 1. Properties of the substances, as recorded in the original study.
In a turbocharged competition engine, exhaust mass affects the energy available to the turbocharger. Alongside the torque measurements, we therefore compared the exhaust masses of different fuels. The calculation used the following simplifying assumptions:
- Petrol consists only of octane.
- Combustion is complete, with no side reactions.
- The engine receives exactly the air required for stoichiometric combustion.
- Non-reacting components of the intake air pass through the engine unchanged.
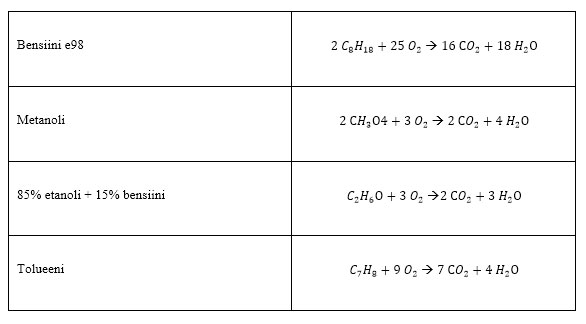
Figure 2. Reaction equations used in the original comparison.
One mole of fuel produces the quantities shown below.
| mol | mol | (g/mol) | Moles in 1 kg | Exhaust mass per kilogram of fuel burned | |
| E98 petrol | 8 | 9 | 114.2 | 8.76 | 16.1kg |
| Methanol | 1 | 2 | 32 | 31.25 | 7.5kg |
| 85% ethanol + 15% petrol | 2.9 | 3.9 | 56.3 | 17.76 | 11.8kg |
| Toluene | 7 | 4 | 92.1 | 10.86 | 14.5kg |
Figure 3. Calculated exhaust masses.
3. Water–methanol injection in competition
Competition places substantial demands on an engine. Conditions can vary considerably between events, while homologation rules may require the same cooling system throughout a championship. The installation must therefore be compact but still provide adequate cooling.
The thermal loads of racing engines often require additional approaches to cooling. Turbocharging raises intake and exhaust temperatures, and extracting the last available performance from an intake-restricted turbo engine can create considerable heat load. In many competition installations, coolers are kept as small as possible while retaining sufficient capacity under favourable conditions.
Coolant temperature is not necessarily the main limitation: charge-air cooling can be the more difficult problem. Cooling airflow may also be obstructed, for example by leaves or snow during a rally. Water injection can provide additional temperature control, although it does not replace a correctly designed cooling system.
ECUs commonly use intake-air temperature compensation to retard ignition as temperatures rise and knock risk increases. Retarding ignition can protect the engine, but torque falls. Water–methanol injection can help limit the temperature increase before that compensation becomes necessary.
In some installations, the positions of the turbocharger and intake manifold prevent the intercooler from being placed where airflow is favourable. Water–methanol injection has consequently also been used to supplement limited charge-air cooling.
External water spray onto the intercooler is another approach. Evaporation removes heat from the cooler surface. This can be useful where vehicle speed or installation layout limits airflow, and in championships where internal water injection is prohibited. The applicable regulations must be checked for the particular competition.
4. The MW Steel injection system
The following sections describe the system developed and tested by MW Steel for its Toyota Celica rally car.
4.1. Design
We began with our previous experience, but investigated water injection in detail before manufacturing or purchasing components. Commercial systems were generally designed to serve a broad market at a competitive cost. Our aim was a dedicated competition installation, with particular attention to potential weak points.
The starting point was to inject similar quantities into every cylinder, distribute the fluid as uniformly as possible with the fuel, and integrate control into the engine management system. We selected components suited to these requirements and developed parts ourselves where suitable products were not available.
High injection pressure was one of the main challenges. Lower pressure would have simplified the installation, but atomisation was important to the cooling effect we wanted. To help achieve even cylinder-to-cylinder distribution, we built an intake manifold with a dual-chamber plenum designed for a balanced pressure distribution.
The injectors were positioned close to the cylinder head, with one injector per cylinder, controlled by the ECU’s injector drivers. Figure 4 shows the main system components.
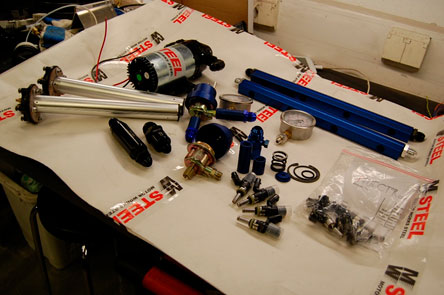
Figure 4. Main components of the water–methanol injection system.
4.2. Components
Component selection focused on pressure capability, flow, material compatibility and integration with the engine management system.
4.2.1. Pump
Pump selection depended on the required pressure and flow. Many pumps suffered a substantial reduction in flow at high pressure. Current draw above 10 bar was another concern for a competition installation.
We selected a US-made Shurflo pump whose specifications met our requirements. The manufacturer stated that it had built-in thermal protection and a free-flow capacity of approximately 4 l/min.
Before installation, we tested the pump and recorded its pressure–flow characteristics. For safety, the tests used water only, on the assumption that the viscosity difference would not greatly affect the results.
| Pressure (bar) | Flow (l/min) | Current (A) |
|---|---|---|
| 0.00 | 4.56 | 2.50 |
| 1.38 | 4.33 | 3.50 |
| 2.76 | 4.03 | 4.30 |
| 4.14 | 3.69 | 5.20 |
| 5.52 | 3.27 | 6.20 |
| 6.90 | 3.04 | 7.10 |
| 8.27 | 2.77 | 7.80 |
| 9.65 | 2.47 | 8.60 |
| 11.00 | 2.20 | 9.40 |
| 12.40 | 2.10 | 9.50 |
| 13.80 | 0.30 | 10.00 |
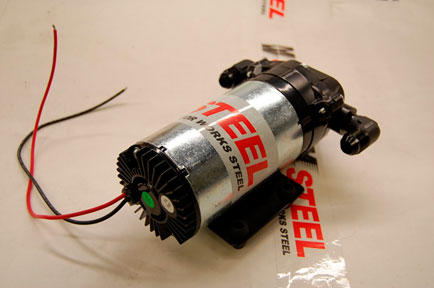
Figure 5. Water–methanol injection pump.
4.2.2. Injectors
We used Bosch 260 cc injectors. Their rated flow, measured at 3.5 bar, was close to the requirement, and their flow increased reasonably consistently with pressure compared with some alternatives.
The needle and other wetted parts needed to be stainless steel to reduce the risk of corrosion affecting operation. Compact dimensions and 14-ohm impedance were also selection criteria.
Maximum opening pressure had to be considered: the injector needle moves against fluid pressure, which can place excessive demand on the injector coil.
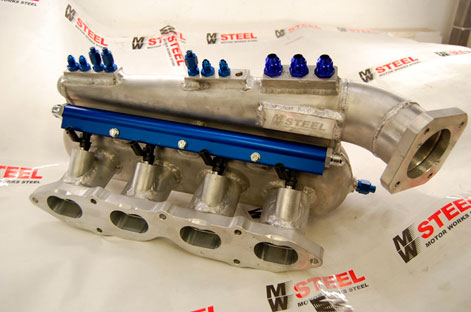
Figure 6. Intake manifold with water–methanol injectors.
4.2.3. Pressure regulator
A suitable regulator was not available off the shelf, so we used a Bosch regulator as the starting point. Its valve, diaphragm and flow capacity were suitable for modification. The passages were 14 mm in diameter and were connected using AN8 fittings.
We removed the pressed cover and machined an adjustable replacement, a seat for two springs, and the other parts needed for the dual-spring arrangement. The original design calculation used a spring arrangement described as approximately 100 psi, with the aim of achieving a system pressure of about 10–15 bar.
The aluminium components were anodised to reduce corrosion.
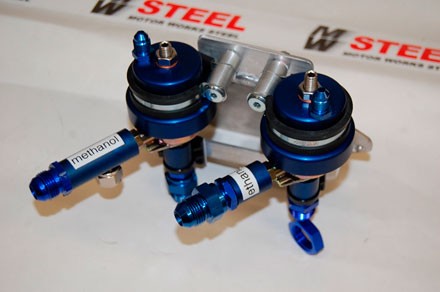
Figure 7. Pressure regulators.
4.2.4. Plumbing and tank
The lines used Goodridge AN8 PTFE hose with a stainless-steel braid. Bulkhead fittings were used through the firewall in accordance with the competition requirements, and the remaining connections also used AN fittings commonly found in aviation and motorsport.
We selected PTFE because experience with methanol and nitrile rubber was inconsistent, and we did not want to introduce that uncertainty into the installation.
The injection rail was machined from a blank with a 16 mm internal bore, adding injector seats, threads and mounting points. It was anodised to protect the aluminium from water-related corrosion.
The tank was a rectangular 20-litre competition fuel tank made from 3 mm anodised aluminium and fitted with safety foam. Capacity was chosen with anticipated stage lengths, service intervals and refuelling stops in mind.
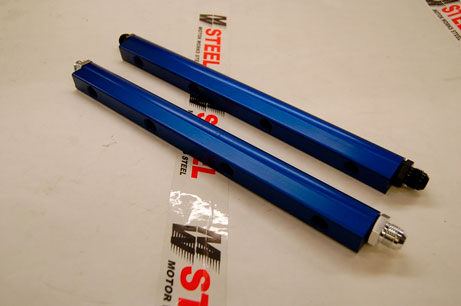
Figure 8. Injection rails.
4.2.5. Engine management
A KMS MD35 ECU was installed alongside the water–methanol system. Compared with the previous ECU, it offered more capacity to manage the engine and the injection system together. CAN communication provided information useful for assessing operation.
Two intake-air temperature measurements were available: one near the intake valve and another close to the throttle. Five K-type exhaust temperature sensors were used, with one downstream of the turbine and the other four at the exhaust ports immediately after the valves. A sensor in the fuel return line measured fuel temperature and alcohol content.
These inputs also allowed programmed fail-safes based on excessive intake or exhaust temperature. The four manifold-mounted water–methanol injectors were operated in pairs by the ECU’s injector drivers. They had a separate fuel map, adjustable in two or three dimensions.
MAP was used as the load signal. This helped avoid excessive water delivery during conditions such as starting. With 375 map points available, delivery could be set for individual engine-speed and load combinations.
The injector in the charge pipe was activated in response to high intake temperatures, primarily as an additional measure against knock. It drew 2.8 A, so a relay was used rather than loading the ECU output directly.
The original study noted that other competition ECUs could support similar control strategies. The exact capabilities must be checked for the ECU used in a particular installation.
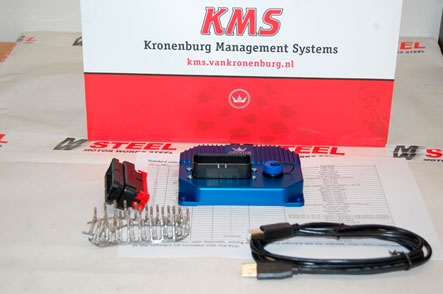
Figure 9. Engine management system.
4.3. Test car
The test vehicle was MW Steel Oy’s Toyota Celica ST205 rally car. We already had substantial measurement data and operating experience with its engine, making it a useful reference.
We wanted a sound baseline installation so that shortcomings elsewhere in the car would not distort the results. Water–methanol injection can compensate for some temperature and knock-related problems, but our aim was to measure its effect on an engine that already worked well rather than conceal weaknesses in the build.
The homologation-compliant competition engine had a displacement of 1,989 cc and a compression ratio of 10.8:1. The turbocharger used a 34 mm intake restrictor.

Figure 10. Toyota Celica ST205 test car.
4.4. Measurement procedure
Before the chassis-dynamometer tests, we checked compression and cylinder leakage. The readings were satisfactory, as expected after only about 100 kilometres of test stages since the engine build.
We performed a four-wheel alignment, aiming for neutral settings to minimise their influence on drivetrain losses and repeatability. New, stiff-sidewall tyres were used to reduce variation caused by temperature-related tyre deformation.
The car was secured at all four corners, with an additional safety strap through the centre. Distances between fixed points on the body and dynamometer were recorded, monitored between runs and corrected where necessary. Boost pressure, engine speed and air–fuel ratio were displayed through the dynamometer’s control equipment.
Testing began by setting the ECU’s basic ignition and fuel maps. Once the baseline was established, formal measurements started with E98 petrol. After the control run, the ignition and fuel maps were adjusted towards the best torque, using an E98 air–fuel ratio of approximately 12.5–13.
Ignition advance and boost were increased until there was no further torque benefit or knock was detected through the monitoring headphones. The water–methanol system was then enabled. Because methanol enriched the mixture, the main fuelling was adjusted while ignition advance and boost were explored again. This continued until the best knock-free torque was obtained.
Several runs showed no benefit from further boost, indicating that the turbocharger was approaching its useful capacity in this installation. Boost was therefore limited to 1.7 bar.
The remaining tests followed the same sequence: first the base fuel alone, then the same fuel with water–methanol injection. Even a small indication of knock, detected acoustically or by the sensor, was treated as a limit. If there was no knock but also no torque improvement, the preceding setting was considered the better result.
The procedure was repeated with three base fuels: E98 petrol, racing petrol and E85. All runs used fourth gear.
Immediately before each run, fuel and water–methanol mixture temperatures were measured by lowering a Fluke immersion probe into the centre of each tank and waiting for the reading to stabilise.
Exhaust-manifold surface temperature was measured with a K-type probe in a 3 mm-deep recess drilled in the collector. This provided a consistent measuring location. Peak readings from all five exhaust-temperature sensors were recorded for each run, along with both intake-air temperatures.
4.5. Results and discussion
Measurements took two working days, with nearly identical conditions on both days. Before testing, we had considered the chemical differences between the fuels and formed expectations about their response to water–methanol injection.
The measurements generally followed those expectations. We anticipated the largest benefit with ordinary E98 pump petrol, and this was the result in our test installation.
E98 petrol
Figure 11 compares E98 petrol alone, shown by the solid line, with E98 plus water–methanol injection, shown by the dashed line. With injection, the torque curve rises earlier and reaches a higher peak.
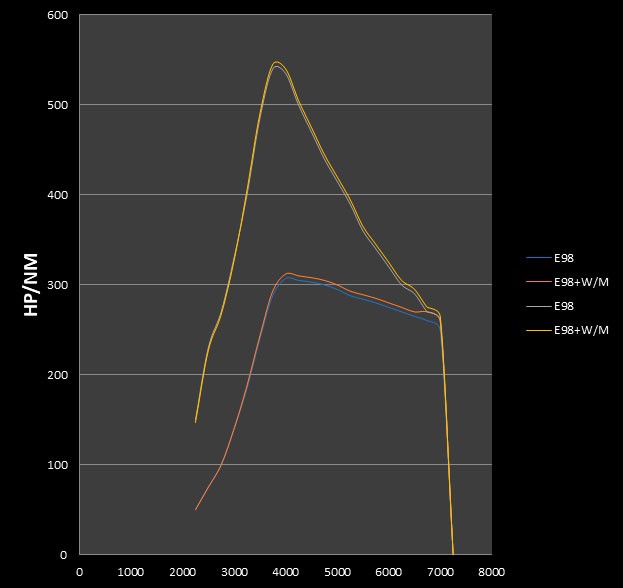
Figure 11. E98 petrol compared with E98 plus water–methanol injection.
Racing petrol
Figure 12 compares racing petrol alone, shown by the solid line, with racing petrol plus water–methanol injection, shown by the dashed line. The difference is smaller than with E98.
One possible explanation considered in the original study was that the dynamometer runs did not reproduce the full thermal load encountered in competition. In that case, exhaust energy at the turbocharger would be lower, and additional cooling from water–methanol injection could reduce exhaust temperature more than desirable for turbo response.
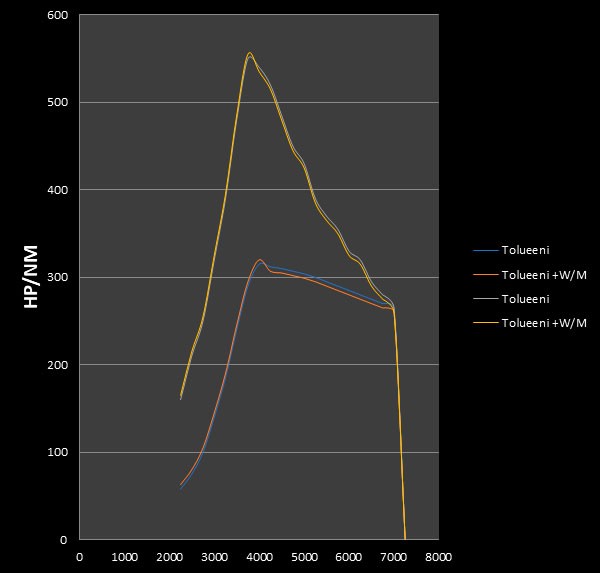
Figure 12. Racing petrol compared with racing petrol plus water–methanol injection.
High-ethanol fuel
Figure 13 compares high-ethanol fuel alone, shown by the solid line, with the same fuel plus water–methanol injection, shown by the dashed line. The torque benefit is smaller again. The original study related this to the similar cooling characteristics of ethanol and methanol.
Intake and exhaust temperatures still fell with injection. The graph also suggests that the turbocharger and exhaust manifold may not have been hot enough at the beginning of the run for injection to help initial response. Sufficient exhaust energy is important during spool-up.
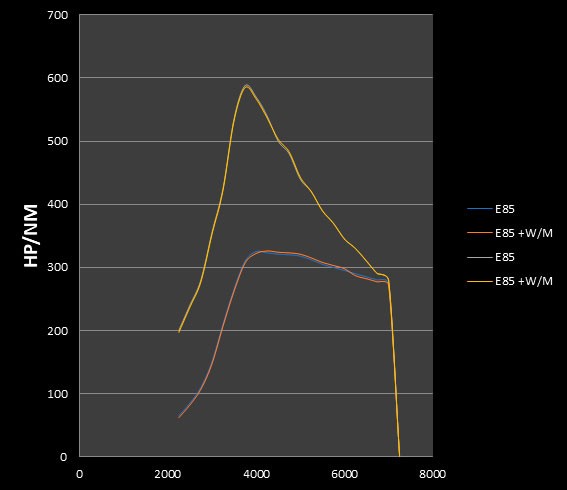
Figure 13. High-ethanol fuel compared with high-ethanol fuel plus water–methanol injection.
Recorded temperatures
| Fuel | Exhaust temperature |
Exhaust-manifold surface (% temperature reduction; source label) |
Water–methanol mixture | Fuel | Intake-air temperature |
| E98 | 650 °C | 24 °C | 22 °C | 49 °C | |
| E98+W/M | 599 °C | 7.8% | 25 °C | 17 °C | 25 °C |
| E98T | 648 °C | 18 °C | 18 °C | 56 °C | |
| E98T+W/M | 526 °C | 18.8% | 18 °C | 18 °C | 22 °C |
| RE85 | 631 °C | 18 °C | 28 °C | 43 °C | |
| RE85+W/M | 594 °C | 5.9% | 20 °C | 13 °C | 24 °C |
Figure 14. Temperatures recorded in the original study. W/M denotes water–methanol injection. The source table labels and values are retained; the percentage column is not a separate surface-temperature reading.
Temperature control and component durability
The original test report described exhaust-temperature reductions of approximately 50–100°C across the cylinders and an intake-temperature reduction of approximately 24°C. These figures refer to this test installation, not a guaranteed result for another engine. The tabulated readings show that the change varied with fuel.
The tests were conducted in cold conditions. Intake temperatures in summer operation could be several tens of degrees higher, so the authors considered the temperature-control results particularly useful.
During the racing-petrol tests, higher exhaust temperatures and improved turbo response were observed. The original discussion attributed these effects partly to the fuel’s toluene content. The exhaust components glowed more strongly, and measured surface temperatures were approximately 100°C higher. Spark-plug deposits and combustion in the exhaust manifold were also discussed as observations requiring consideration.
Water–methanol injection reduced the elevated exhaust temperatures. One potential benefit was reduced thermal stress on the turbocharger and exhaust components. During testing, one turbocharger with an Inconel turbine suffered a failure attributed to excessive speed and temperature, illustrating the importance of these limits.
Torque increased with water–methanol injection on all three fuels in this installation. For the turbocharged engine, however, one of the clearest benefits was the immediate fall in intake temperature when injection began. Intake temperature continued to fall during a run with injection, whereas it rose during runs without injection.
Stage testing and practical experience
By the time of the original report, the system had completed approximately 1,000 kilometres of test stages. Inspections had not revealed signs of wear or fatigue in the injection-system components, or corrosion in the injectors, pump, rails or engine components.
The practical benefits appeared more pronounced on the stages than on the dynamometer. The cold test conditions may also have limited the extent to which the cooling potential was demonstrated.
The car’s anti-lag system and the turbocharger technology of the period gave it an aggressive character. Some stage sections involved prolonged left-foot braking while maintaining a high torque demand. During these practical tests, intake temperatures remained below 20°C.
Intake temperatures did rise while waiting at time controls before a start. Operating launch control for longer than usual allowed injection to begin before the clutch was released. In the reported tests, intake temperature then returned to approximately 20°C while exhaust temperature rose to the desired operating range.
Recorded consumption was approximately 1.4 litres of main fuel per kilometre and 0.7 litres of water–methanol mixture per kilometre. These were observations from this competition car and operating conditions.
Conclusions
Several factors proved important: high injection pressure, intake-temperature sensor location, stable ECU control, effective lambda control and overall system reliability. Failure in any of these areas could remove the benefit or even create additional risk.
In this intake-restricted turbocharged competition engine, the completed system provided useful temperature control and required little maintenance during the reported testing.
Development involved substantial work on delivery rates, sensor locations, response delays and other details. This experience led us to question how closely a simple off-the-shelf kit could reproduce the behaviour of the integrated competition system described here. Results depend on the complete installation and calibration, not merely on adding a pump and nozzle.
4.5.1. Measurement equipment
- Chassis dynamometer: T A T Chassis Dyno Rolling Road Inertia Dyno Systems.
- Exhaust temperatures: KMS MD35.
- Fuel temperatures: Fluke.
- Exhaust-manifold surface temperature: Fluke.